

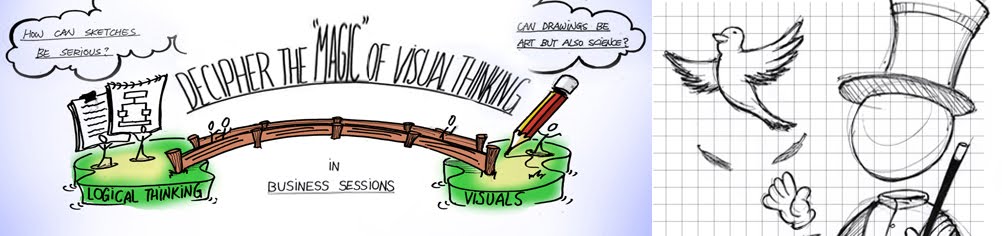
 An idea of Individual visual thinking process has been suggested by Rober H. Mckim in the book, Experience in Visual Thinking (1972).
 This is an initial proposal to make a film about Visual Thinking in JAM visual thinking. In the film, the essential elements of Visual Thinking in the graduation project can be showcased in the film.
 This idea is inspired by the film, RSA Animate: Drive, produced by Daniel H. Pink. The way to present it as a ongoing drawing process in the video, which I think, is an efficient and influential way to express a story or an idea with Visual Thinking.
 This drawing above depicts Visual Thinking processes in sessions: to reach hidden insights deep in people’s minds, come to shared visions and solutions, and finally realize the ideas in practical actions in Visual Thinking sessions. Different from the post: Does the Flow Run only on the Surface or Deep in Minds?, an extended explanation about realizing shared visions into actions is added in the drawing. This conceptual framework in the drawing can therefore be categorized in four major processes and five main stages (See the drawing below).
 According to different features in Visual Thinking process, the five major processes are named: Grounding, Diving, Showing, Lifting, and Landing. The four main stages are named: Common Ground (Shared Mental Models), Personal Insights, Shared Visions, and Action.
 Visual Thinkers in group sessions can distinguish from people's complex thoughts to a clear and still meaningful graphics instantly. They are just like a prism that divide the white light into several colors.
 Here is an example that I did in a research project on Town Watchers, or Wijkagent in Dutch. They are one kind of policemen, and their missions are mainly focused on how to prevent crime in communities instead of punishing crime like normal policemen. We presented the results of our findings in the research as an infographic.
 In the first 3 seconds, we used the main metaphor, an elephant, to represent Town Watcher's compassionate personality and down-to-earth endeavor. We made it as a eye-catching item to attract people's attention and arouse people's interests in it. After their desire to learn more was triggered, n the following 30 seconds, readers can browsing through the various attributes around the elephant, such as a compassionate heart, a huge brain, and a back carrying responsibility. Then, in the lasting 300 seconds, they can learn more about the Town Watchers' daily life by reading the supporting articles and graphics surrounding the poster. The supporting materials ensure that the poster can be frequently revisited and stay fresh, informative, and inspiring.
 (Picture above, Source: XPLANE-examples, Copyright xplane.com)
 (Picture above, Source: Inside Dylan's Brain)
 (Picture above, Source: Infografía premiada en los 2Q/NAO 2007)
 (Picture above, Source: What's In Your Mail?)
 (Picture above, Source: Lance's Last Tour, the graphic and design was done by Michael Mode and Steve Cowden, the text is by Bonnie DeSimone and James Yu. )
 Different drawings or pictures can represent different implications to the readers. So, we can use these properties of drawings to convey "right" information to "right" readers. In his book, ‘Visual persuasion’, Paul Messaris (1997) explores how images help advertisers to bring their points across. He described the images with three properties:
 The picture above explains the learning effects of different types of illustrations in textbooks. This picture is a replication from an illustration in the book, "Context and Conceptualization" (Stappers et al., 2005. p. 103).
 We see a number of things before we start to think. Actually, it all happens in a split second, and you don't even notice this.
 In their newly-released paper: Understanding Visual Thinking: The History and Future of Graphic Facilitation, Christine Valenza and Jan Adkins (2009) described the nowadays global economy model with a metaphor: the neuron, compared to a vertical ladder in the Middle Ages and a flat web in the industrial age. They further explained the idea that modern people deal with the complex world by near-instant communication plugging into all levels of a problem and with multiple variables . The nonlinear thinking process for human ingenuity and creativity is rather like a human’s neuron networks than a machine.
 involve expertise with no manufacturing and commercial background, such as psychology, social science and biology. The flip chart in 1950s was probably the most well-known tool for presenting ideas and recording process in a meeting. People developed the flip chart as a more elaborate VT/GF tool with knowledge of Gestalt awareness, corporate learning, group dynamics, mind maps etc. Therefore, the poster in the front of a group in a conference could record a propound view with assembled graphics, numbers, and arguments.

 1. Multiple supporting roles in terms of "process" and "result" in a workshop:
 3. Visual thinking is especially good at dealing with novel and complex problem:
 5. Drawings are flexible in the levels of translation:
 "Professional Visual Facilitators Mariah Howard and Julie Gieseke bring whiteboards, pens,cameras and one question to the Maker Faire: What does sustainability look like? Here is the harvest of images they discovered from the Makers"
 This is a book about visual thinking in an everybody-can-do-it way. With a pen, a piece of napkin and your bare hand, you are already equipped enough to solve all of the problems you can image even they are as complex as a modern business problem. The drawing power has manifested itself in this book with a series of interesting and meaningful stories and, of course, a lot of illustrations.
 In this book, another interesting thing I found is the four steps of visual thinking process, which are "Looking", "Seeing", "Imaging", and "Showing". "Looking" is like you browse through the room when you step in a party. "Seeing" is like you notice some familiar faces. "Imaging" is that you think what will happen if you go to them. "Showing" is to choose one girl you know to go to because you are most willing to do so. I think here the four steps of visual thinking process are the basic principles I am looking for. I always believed visual thinking is indeed originated from some really basic and simple principles, which are "built-in" in human beings.
 Last but not least, it is so interesting to see underlying connections (or similarities) between Dan Roam's Visual Thinking Process and Visual Design Process in JAM visual thinking. Just like the picture above, "Collecting elements" is "Looking". "Finding coherence" is "Seeing". "Composition" is "Imaging". "Translation" is "Showing". It is so evident that the visual thinking process described here really makes sense in both personal experience and real practice. This is indeed a simple, basic principle lying in our nature.
 It is a video produced by commoncraft. They produced the video to explain something we might hear from a lot in daily life but never got a chance to look into them deep, for example, twitter, podcasting, blogs, electing a US president, and even "Zombies!". With simple drawing elements and light animation effects, they create a special visual language to explain complex things.

